

HOW TO SELECT STOCKS FOR HIGH DIVIDEND YIELD INVESTMENT

By Neoh Soon Kean B.Sc. MBA Ph.D.
Sim Ye Wei B.Mgmt. CFA
PREAMBLE
This article is intended to show you how you may use Bursa Malaysia’s public database to sieve out information and help you make investments following our recommended “High DY Stocks” approach. Around the middle of this year, Bursa made changes to the format and appearance of its database. After studying the new data presentation for some time to observe its stability, we are pleased to say that Bursa has retained much of the original format in its new database and hence we can proceed with this illustrative article.
In an earlier article of this investment series, we explained that you will have to use public investment databases to uncover the required information to enable you to make your stock selection. Although there are a number of public databases, we have decided to use Bursa’s own website (Bursa Marketplace) to obtain the required information as it is one of the most complete and convenient to use. Bursa Marketplace provides a powerful “SCREENER” function which will sieve out all the stocks which fit your selection criteria.
HOW TO FIND THE SCREENER FUNCTION ON THE WEBSITE?
In Google Search, go directly to the Screener page using the link below:
Bursa Marketplace
https://www.bursamarketplace.com/mkt/tools/screener
Click to download
BursaMKTPLC: The Screener – Bursa Marketplace

The Screener tool helps to search for companies by industry, market capitalisation, share price, P/E ratio, and dividend yield among others. For each search criterion, they will give us a range of options to help us refine our search.
USING THE SCREENER FUNCTION
Once you have opened the Screener, let us see how we can use it to help us sieve out stocks that match our criteria. Just as an aside, before we define any search criterion, the function would show the total number of companies in the database and it is 1067 (Under “Total Matches”)! Imagine how difficult it would be to make your choices if you do not refine the search method.
Our first criterion is HIGH DIVIDEND YIELD. From the snapshot on the left below, under the field of DIV. YLD, we select the option of “Above 5%”. Our second criterion is LARGE MARKET CAPITAL. Hence, we choose “Above 1 Billion” under the MKT CAP field. With both our search criteria entered, we click on the “Show Result” button at the Total Matches section (on the right of the page). As you can see, the total number of stocks has been narrowed down to 34 from 1067 before (at time of writing)!
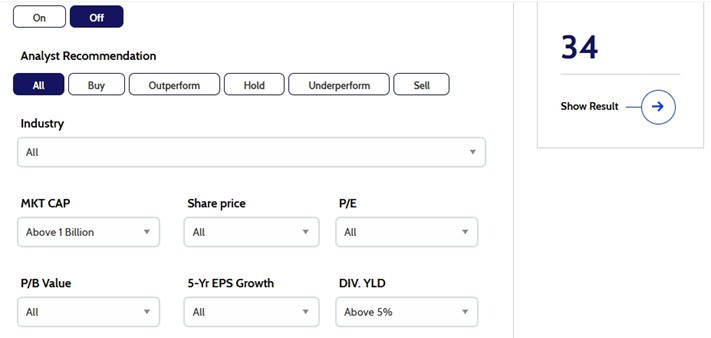
It is thus quite easy to sieve out the stocks based on our investment criteria with the help of Screener on Bursa Marketplace. As for those who want to have a more personalised selection criteria (e.g. DY of 6%), you can click on the switch to Advanced Screener button on the top right side of the page to continue with your screening.
The first result of the search from the Bursa database shows that there are 34 stocks with DY or above 5% that we could invest in. We can refine our search by sorting the DIV YLD criterion in an ascending or descending order, by clicking the arrow on the header row.
Be aware that the data will be continuously changing to reflect stock performances as they evolve.

Using the data in the list of shares we can start to choose the smaller number of shares we would like to invest in. As stated in the previous article, you would want to start by choosing the companies with the highest dividend yield (DY). So you start with more in-depth analysis from the top of the list.
But as previously discussed, pure DY as an investment criterion has one serious problem – it does not consider how stable the dividend is. The high dividend for the current year could be due to a particularly good year but isn’t likely to continue in the future.
Let us take UOA Development (the 1st company on the list at time of writing) as an example. It has an exceptionally high DY of 15.87% and would seem like a “steal.” But that was because it had paid dividend twice for 2023 totalling 30 sen, resulting in a high dividend yield of 15.87% (dividend per share in 2023 [30 sen] / share price [RM1.91]). UOA Dev paid only a 10 sen final dividend in July 2024, yielding around 5.5%. On that basis, UOA Dev would likely fall down the list.
How do we find out if the dividend is not a one-off event or if it is likely to be consistent? Again, as previously discussed, consistency of dividend and earnings is an important selection criterion after the first cut.
Let us take another company on the list, Ta Ann Holdings, to see how we can confirm that the current dividend of 7.13% is consistent and likely to be repeatable.
In order to investigate deeper into a company we are interested in, we can click on the name of the stock and we will be brought to the screen shown below which provides some market information on Ta Ann as well as providing the links to several other pages of information on the company. As a start, we can learn about the company’s history from the ‘Profile’ tab. This information will be of help to you in narrowing down the number of companies in your portfolio.
Remember, we had previously said that one must diversify the industrial sectors from which we select our stocks. If you intend to have 30 stocks in your portfolio, you may want to choose from up to 10 industrial sectors.

Earlier, we have said that the consistency in terms of earnings and dividend is an important selection criterion. It is not very useful to have just one or two years of high dividend. By clicking on the ‘Financial’ tab, and under the Income Statement, we can find the financial data for the past five years as shown below. Amongst the long list of items that appear in the Income Statement, we can look for “Basic EPS (Earnings Per Share) Excluding Extraordinary Items” and “DPS (Dividend Per Share) – Common Stock” for consistency of earnings and dividend performance.
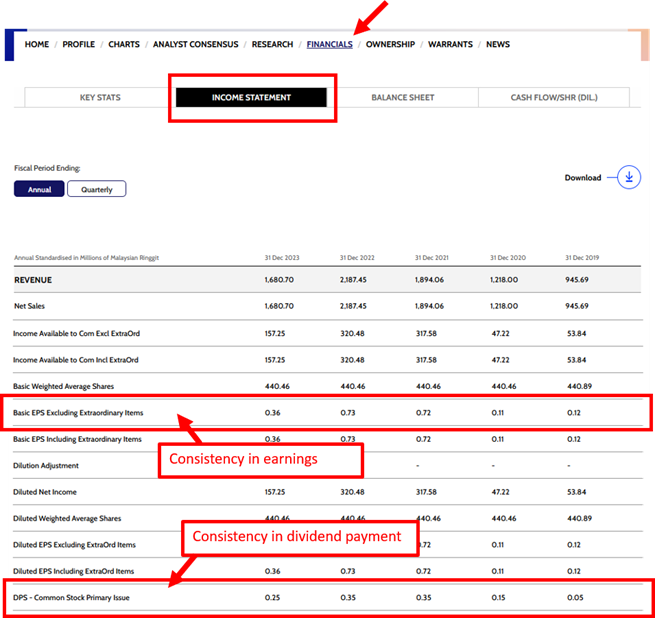
From the data provided, we can say that Ta Ann had gone through a couple of years of low earnings and dividends (2019 and 2020) likely due to the Covid pandemic. In the last three years, its earnings and dividends have become much more substantial and consistent. If you would like to have some oil palm stocks in your portfolio, you can compare the results of Ta Ann shown above with that of other plantation companies on the list and choose 2 or 3 with the most consistent earnings and dividends.
One caveat to remember: a company can only pay dividends from current or accumulated earnings. Without good consistent earnings, there is a good chance that the excessively high dividend (i.e. dividend which is higher than earnings) we see now may be cut in the future.
All that remains for us is to wish you the best of luck if you decide to start becoming a seasoned investor.